The Cause Consequence
methodology
originates from the nuclear industry
and is employed for modelling risks arising
from products and processes. The methodology used has not changed significantly
since the early 70s
and uses linear estimation of probabilities
in order to generate a quantified measure for the undesirable events predicted
by a risk model.
The Advanced Cause Consequence
Analysis
(ACCA
)
tool is a method by which the user can produce a risk model using various building
blocks (known as Symbols) which can be drawn onto one or more Worksheets to
represent the Hazard
.
The Critical Event
identifies the starting point of the scenario
and usually pertains to a Hazardous situation being analysed. Several Hazards
can be linked together, each with a single Critical
Event, as an Undertaking
.
Once the risk scenario has been drawn it is
validated and an Excel
compatible Algorithm File (ALF
)
can be generated for subsequent simulation
.
ISAE
provides the necessary environment to allow
the existing ACCA
tool to run over and update its data elements.
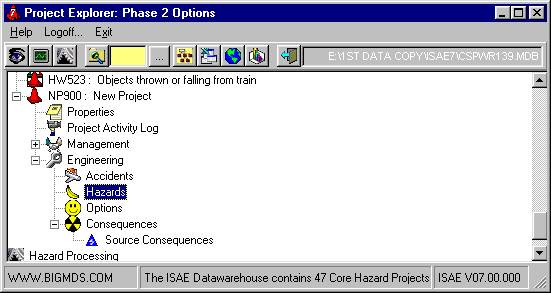
The Explorer screen allows access to the following
items from within the Engineering
information folder:
Þ
System Parameters
Þ
Parametric Sets
Þ
Consequences
In addition, Hazards
added to ISAE
under the Engineering
Information folder on the explorer screen are
duplicated on the Explorer screen underneath
the Engineering Information folder as shown:
This is to provide quick and easy access to
ACCA
functions without having to navigate any further
through ISAE
.
ACCA
Functions accessible from here and how to access
them are as follows:
|
ACCA
Function |
How
to select the function |
Result |
|
Report Function |
·
Select a project
·
Right mouse click
·
Select Reports |
The Report Screen is displayed allowing the
user to select the type of Report required |
|
Generate an integrated ALF
for a project
|
·
Select a project
·
Right mouse click
·
Select Generate Integrated ALF
|
The system opens an Excel
spreadsheet and generates the algorithm file. |
|
View Project Log |
·
Expand the contents of a Hazard
·
Double-click on Project Activity
Log |
The Log screen for the project is shown. |
|
Export an existing project
|
·
Select a project
·
Right mouse click
·
Select Export |
The system will take the user to the Apportionment
screen. |
|
Create Apportionment Tables |
·
Select Project
·
Right mouse click
·
Select Create Apportionment
Tables
|
The system will take the user to the System
Parameter List screen. |
|
Delete this Project |
·
Select Project
·
Right mouse click
·
Select Delete |
The system will request confirmation of the
delete request. The user can either cancel or confirm the delete. |
All these functions are available for Hazards
shown on the Explorer underneath the
Engineering
Information folder.
|
Function |
How
to select the function |
Result |
|
View/Maintain the Hazard
Definition |
·
Expand the contents of a Hazard
·
Double-click on Hazard Properties
|
The system will take you to the Hazard
Definition screen. |
|
View Hazard Activity Log |
·
Expand the contents of a Hazard
·
Double-click on Hazard Activity
Log |
All the events in the life-cycle of the Hazard
can be viewed on the right of the Screen by expanding it to the right |
|
Add a new Causal or Consequence Worksheet
to an existing Hazard |
·
Select either Causal or Consequence
Analysis
·
Right mouse click
·
Select Add Worksheet
|
The system will create a Worksheet
with the name Worksheet X, where X is the next number in sequence.
The Worksheet is opened ready for input. |
|
Verify that an existing Hazard
is complete |
·
Select an existing Hazard
·
Right mouse click
·
Select Verify |
See Verification and Integrity Check of
the Hazard
|
|
Generate an ALF
for an existing Hazard
|
·
Select an existing Hazard
·
Right mouse click
·
Select Generate ALF
|
The system opens an Excel
spreadsheet and generates the algorithm file. |
|
Delete this Hazard
|
·
Select Hazard
·
Right mouse click
·
Select Delete |
The system will request confirmation of the
delete request. The user can either cancel or confirm the delete. |
The following functions are available for worksheets
shown on the Explorer as part of Hazards shown underneath the Engineering
Information folder.
|
Function |
How
to select the function |
Result |
|
Edit the worksheet
diagram |
·
Select a Worksheet
·
Right mouse click
·
Select Edit Diagram |
The system will take you to the Worksheet
Editor screen. |
|
Edit the worksheet
details |
·
Select a Worksheet
·
Right mouse click
·
Select Edit Details |
The system will take you to the Worksheet
Details screen (see ACCA
User Guide) |
|
Delete the worksheet
from the system. |
·
Select a Worksheet
·
Right mouse click
·
Select Delete |
The user will be prompted to confirm deletion
of the worksheet
. Conformation will
result in the worksheet and its details being removed from the system. |
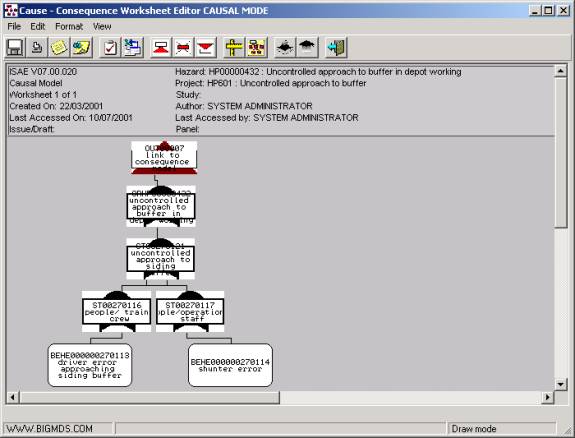
Unlike earlier version ISAE7 no longer links
to external causal tools but uses its own worksheets to illustrate the causal
logic. The worksheets are now split into Causal Analysis and Consequence
Analysis. Create and access the worksheets as
before.
NB: Users using older causal data
should note that the causal worksheet
has a facility to import the external causal
data, this data is then removed from the ISAE
database so ensure you have a backup of the
data, and stored in its internal format.
Because of the complexity of the causal diagrams
automated processed have to be added to assist the layout of the causal diagram.
Selecting an AND or OR gate and clicking on the RH mouse click the menu shows
the following functions:
Base events now have classification codes.
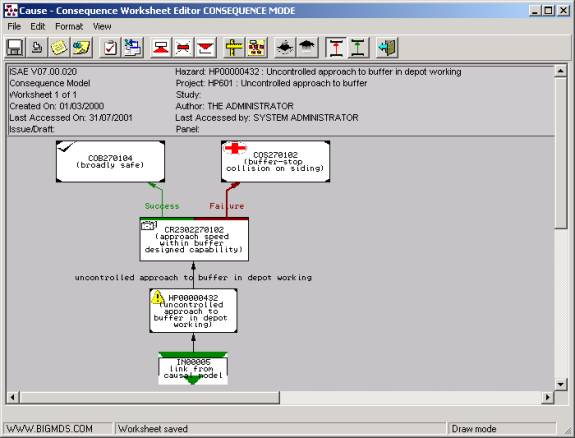
This Screen displays a Worksheet
area in which the various Symbols can be drawn
and linked together logically to produce the required Risk Scenario
.
At the top of the Worksheet
drawing area is the title area which contains
information about the Worksheet, the original Author, the Issue/Draft, whether
Authorised or not and Modifications. The application automatically maintains
this title area on the Worksheet. If this information requires editing the user
must return to the relevant screens as follows:-
|
Þ
Model Detail Screen |
to
change the Study or Panel details |
|
Þ
Worksheet
Details Screen |
to
change the Author or Issue/Draft details |
The graphical work area is manipulated by using.
the menus and buttons at the top of the screen and the options available when
the user right-mouse clicks on an empty area of the work area. For information
on drawing the worksheet
model itself see section 13.1.5
.
The following menu functions are also available:-
|
File
|
This allows the user to Save, Print
or Close the Worksheet
. |
|
Edit
|
This allows the user to manipulate the worksheet
detail by changing the size, font and cutting
and pasting items on the worksheet. |
|
Format |
This allows the user a variety of options
to format the layout of the worksheet
. |
|
View
|
This allows the user to Zoom in, out or to
fit the page, view the Worksheet
grid or Snap to grid or manipulate the colours
used on the worksheet
. |
Remaining specific ACCA
functions that are available from within a Hazard
are accessed in the same way as described in
the ACCA user guide.
Once the Worksheet
has been opened the user can begin drawing the
Model in the Worksheet Editor Screen.
In order to do this the relevant Symbols must be placed on the Worksheet
and connected by Relation Lines until the Model is complete. The Model can extend
over several Worksheets using In- and Out- Connectors
. Once the Model is completed to the users satisfaction
each Worksheet must be saved (File/Save) and can be printed.
For further detailed information on producing
the Model see the topics below.
To place a Symbol
onto the worksheet
,
move the cursor to a blank area of the worksheet and press right-mouse click.
The following menu will appear:
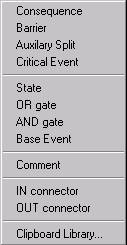 |
Select the Symbol
required from the menu. A detail screen specific
to the type of Symbol selected will appear prompting for information about the
Symbol. Fill in the required details on the screen and press the save button.
The Symbol will appear on the worksheet
.
The available Symbols are described on the
following pages and the relations are shown on page 80.
These pertain to a range of physical, procedural
and human factors related systems, measures or actions which might prevent or
mitigate against the further escalation of a Critical Event
into an undesirable Consequence
(accident
).
The number and connectivity of the Barriers within each diagram constitutes
the algorithm for the development of the Critical Event into a number of potential
Consequences.
The inputs can originate from one or more of
the following sources:-
·
another Barrier
output
·
a Connector output
·
an Auxiliary Symbol
·
a Critical Event
The outputs are generically named Fail (red)
and Success (green) and basically constitute the logical paths out
They can each link to one of the following
Symbols :-
·
another Barrier
input
·
a Connector input
·
an Auxiliary Symbol
·
a Consequence
Each time a new Barrier
is created the Barrier Screen is displayed to
allow the user to 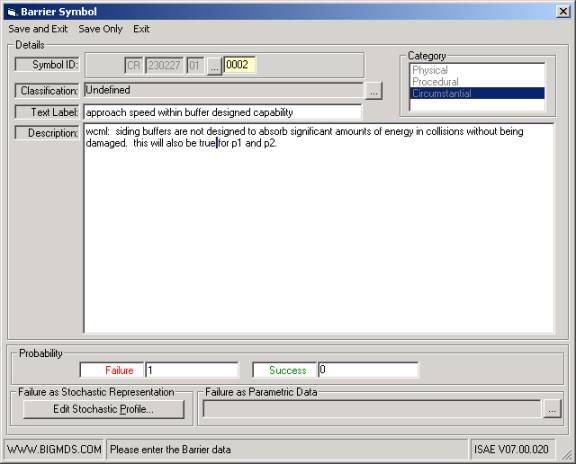
enter the required details.
The following fields may be entered:-
|
Symbol
Id
|
Mandatory 14 characters defining the Symbol
as follows:
·
Characters 1-2 - set to PH(Physical),
PR(Procedural) or CR(Circumstantial depending on the category selected)
·
Characters 3-8 - set by the Classification
code selected
·
Characters 9-10 -
set by the Company code selected
·
Characters 11-14 4 digits uniquely
defining the Symbol
NB If Symbol
Rules off
is selected, the Symbol ID can be any characters up to a length of 20. |
|
Text
label |
Mandatory. A text label of up to 50 characters.
This also appears on the Symbol
in the Worksheet
. |
|
Description
|
Optional description of up to 230 characters. |
|
Classification
|
Using the
button select the classification
code which this Barrier
most closely fits, the Category
is automatically set accordingly. |
|
Probability
|
The Failure and Success texts may be
altered if required to something more appropriate of up to 10 characters
in length. The Failure Probability
is a figure greater than 0 but not greater
than 1. The probability of Success is calculated automatically as 1 minus
the probability of Failure. |
See section Parametric Variables and Formulae
for details on how to set up a Parametric formula for this Barrier
The Critical Event
(CE) identifies the starting point of the Model
and usually pertains to a Hazardous situation being analysed. There is only one CE per model, usually placed
at the bottom or left hand side of the page.
A Critical Event
has only one output link that can be connected
to a Barrier
or an Auxiliary Symbol
.
Each time a new Critical Event
is created the Critical Event Screen is displayed
in order to enter further information.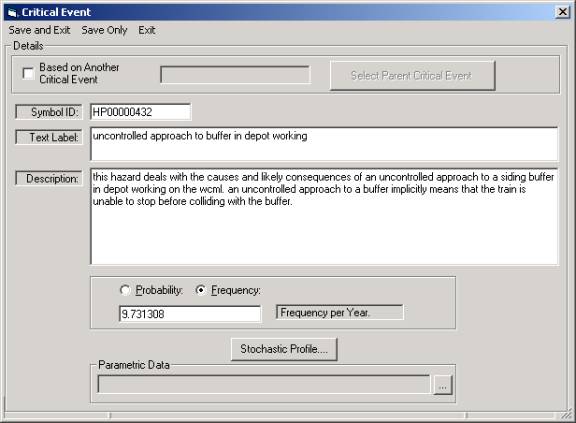
The following fields may be entered:-
|
Symbol
Id
|
Mandatory. From 5 to a maximum of 10 characters
defining the Symbol
. It appears on the
Symbol in the Worksheet
|
|
Text
label |
Mandatory. A text label of up to 50 characters.
This also appears on the Symbol
in the Worksheet
. |
|
Description
|
Optional description of up to 250 characters. |
|
Probability
/ Frequency
|
One of these must be selected. The Probability
must be a decimal number greater than 0 and
up to 1 (default value is 1. The Occurrence is an integer in the range
1 to 30,000. |
The CCA methodology
employs Symbols (Critical Events
,
Barriers etc.) to capture the escalation scenario associated with a Hazardous
condition. In this context, a Consequence
represents the end of a line of reasoning, culminating
in an event which may be desirable or undesirable.
A Consequence
may have many inputs, but has no outputs.
The input connections can originate from one
of the following sources:-
·
Barrier
output(s)
·
Connector output(s)
·
Auxiliary Symbol
(s)
Each time a new Consequence
is created the Consequence Screen is displayed
in order to enter further information.
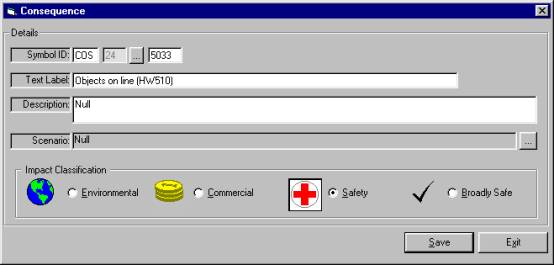
The following fields may be entered:-
|
Symbol
Id
|
Mandatory. From 5 to a maximum of 10 characters
defining the Symbol
. It appears on the
Symbol in the Worksheet
. |
|
Text
label |
Mandatory. A text label of up to 50 characters.
This also appears on the Symbol
in the Worksheet
. |
|
Description |
Optional Description of up to 250 characters. |
|
Scenario
|
Optional. An Accident
Scenario
can be selected from the list which is displayed
by pressing the button to the right. |
|
Impact
Classification
|
One of the following classes must be selected:
Environmental, Safety, Commercial or Broadly
Safe. |
When the Comment Symbol
is selected a box is drawn in the Worksheet
where the user can enter any text required.
To edit the text double-click on the comment box. The comments can also be resized by selecting a corner and dragging
it to the required specification.
Once created a Comment can be attached to another
Symbol
in the Worksheet
via the blue relation line. This line is for
documentation purposes only and has no logical significance for the Model. A
Comment may not have any inputs.
An AND Gate
is a logical Symbol
which multiplies a number of inputs and generates
one output. It is used to influence the Probability
of a Barrier
or Critical Event
.
The inputs can originate from a number of Basic
Event
or other Gate outputs (default 2).
The output can link to a State
,
Barrier
,
Critical Event
or Out-Connector only.
Each time a new AND Gate
is created the AND Gate Screen is displayed
in order to enter further information.

The following fields may be entered:-
|
Symbol
Id
|
Mandatory. From 5 to a maximum of 10 characters
defining the Symbol
. It appears on the
Symbol in the Worksheet
. |
|
Description
|
Mandatory. A description of up to 50 characters.
This also appears on the Symbol
in the Worksheet
. |
|
Memo |
Optional further description. |
An OR Gate
is a logical Symbol
which subtracts the product of its inputs from
the sum of the inputs and generates one output. It is used to influence the
Probability
of a Barrier
.
The inputs can originate from a number of Basic
Event
or other Gate outputs (default 2).
The output can link to a State
,
Barrier
,
Critical Event
or Out-Connector only.
Each time a new OR Gate
is created the OR Gate Screen is displayed in
order to enter further information.
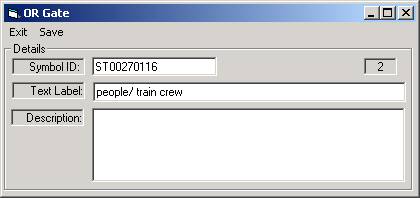
The following fields may be entered:-
|
Symbol
Id
|
Mandatory. From 5 to a maximum of 10 characters
defining the Symbol
. It appears on the
Symbol in the Worksheet
. |
|
Description
|
Mandatory. A description of up to 50 characters.
This also appears on the Symbol
in the Worksheet
. |
|
Memo |
Optional further description. |
This Symbol
depicts the result of a logical combination
arising from AND-Gates and/or OR-Gates.
The State
will produce the probability for a Barrier
.
It is an alternative to inputting a probability in the Barrier dialog box. The
probability is deduced from the States input instead.
A State
has one input and one output only.
The inputs can originate from the logical output
of AND and OR gates only.
The output can only link to a Barrier
.
Each time a new State
is created the State Screen is displayed in
order to enter further information.
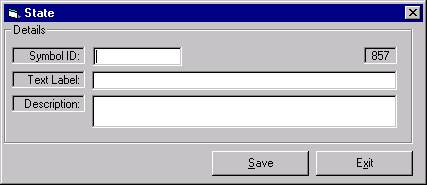
The
following fields may be entered:-
|
Symbol
Id
|
Mandatory. From 5 to a maximum of 10 characters
defining the Symbol
. It appears on the
Symbol in the Worksheet
. |
|
Text
label |
Mandatory. A text label of up to 50 characters.
This also appears on the Symbol
in the Worksheet
. |
|
Description
|
Optional description of up to 250 characters. |
An Auxiliary Symbol
constitutes a logic flow support structure.
It can be either a Parallel Gate or a Splitter
Gate. It is designed to distribute the probability
according to certain criteria instead of simply Fail/Pass as in a Barrier
.
An Auxiliary Symbol
allows the manipulation of multiple direction
probabilities by splitting the probabilities evenly (Parallel) or dividing them
in a predetermined (weighted) fashion (Splitter).
A Parallel Gate
takes one input and generates multiple equivalent
outputs (to a maximum of 5), weighted to add up to the value of the input.
A Splitter Gate
takes one input and splits it into a number
of outputs (to a maximum of 5), which add up to the value of the input.
The input originates from a Barrier
output or an In-Connector.
The output can link to a number of potential
Symbols namely:-
·
a single Barrier
input
·
a Connector input
·
a Consequence
Each time a new Auxiliary Symbol
is created the Auxiliary Symbol
Screen is displayed in order to enter further
information.

The following fields may be entered:-
|
Symbol
Id
|
Mandatory from 5 to a maximum of 10 characters
defining the Symbol
. It appears on the
Symbol in the Worksheet
. |
|
Text
label |
Mandatory. A text label of up to 50 characters.
This also appears on the Symbol
in the Worksheet
. |
|
Class
|
One of Procedural,
Physical or Circumstantial must be selected |
|
Type
|
Parallel/Splitter (see above) |
|
No.
of outputs |
A figure between 2 and 5 |
|
Output
Descriptions |
A description of each output of up to 50
characters. |
|
Weighting
|
For a Splitter Symbol
a weighting must be entered for each output
in the range 01 - 99. The sum of the weightings must be equal to 100.
The input value will be distributed accordingly. |
These are primary failures of equipment or
human actions
The Basic Event
output provides input for Gates only. It supports
no inputs.
Each time a new Basic Event
is created the Basic Event Screen is displayed
in order to enter further information

The following fields may be entered:-
|
Symbol
Id
|
Mandatory 16 characters defining the Symbol
as follows:
·
Characters 1-2 - always set to
BE
·
Characters 3-4 - set to PH(Physical),
PR(Procedural) or CR(Circumstantial depending on the category selected)
·
Characters 5-10 - set by the
Classification
code selected
·
Characters 11-12 -
set by the Company code selected
·
Characters 13-16 4 digits uniquely
defining the Symbol
NB If Symbol
Rules off
is selected, the Symbol ID can be any characters up to a length of 20.
|
|
Classification
|
Using the
button select the classification
code which this Base Event most closely fits, the Category
is automatically set accordingly. |
|
Text
label |
Mandatory. A text label of up to 50 characters.
This also appears on the Symbol
in the Worksheet
. |
|
Description
|
Optional description of up to 250 characters. |
|
Probability
|
A decimal number greater than 0 and up to
1 (default value is 1). |
|
Frequency
|
A decimal number defining the Frequency
.
|
Connectors
are essentially continuity pointers to the rest
of a large Model which cannot be contained on a single Worksheet
.
An In-Connector must be linked from an Out-Connector on another Worksheet in
the same Model.
An In-Connector can link to:-
·
a Barrier
input
·
a Consequence
·
an Auxiliary Symbol
input
Each time a new In-Connector is created the
Connector Screen is displayed in order to enter further information.
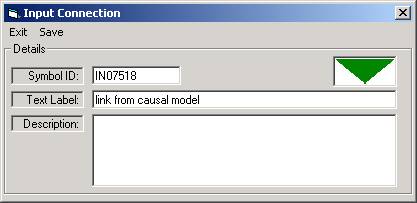
The following fields may be entered:-
|
Symbol
Id
|
Mandatory. From 5 to a maximum of 10 characters
defining the Symbol
. It appears on the
Symbol in the Worksheet
. |
|
Text
label |
Mandatory. A short description of the In-Connector.
This also appears on the Symbol
in the Worksheet
. |
|
Description
|
Optional description of up to 250 characters. |
Connections can be made from Out-Connectors
to In-Connectors in the same Model.
An Out-Connector originates from:--
·
Barrier
output(s)
·
Auxiliary Symbol
output(s)
Each time a new Out-Connector is created the
Connector Screen is displayed in order to
enter further information.
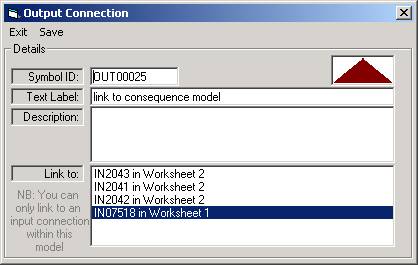
The following fields may be entered:-
|
Symbol
Id
|
Mandatory from 5 to a maximum of 10 characters
defining the Symbol
. It appears on the
Symbol in the Worksheet
. |
|
Text
label |
Mandatory. A short description of the Out-Connector.
This also appears on the Symbol
in the Worksheet
. |
|
Description
|
Optional description of up to 250 characters. |
|
Link
to |
A list of the Symbol
-Ids of the existing
In-Connectors
in the Model. The user must select the name
of the In-Connector to be linked to this Out-Connector from the list. |
To connect two Symbols, the user must carry
out the following steps:
1.
Click on the source Symbol
.
A dot will appear in the centre of the selected Symbol. Click on the centre
dot and drag the connection to the target Symbol. A line will be drawn as the
mouse is dragged to indicated the area covered by the new Relation. An arrow
head determines the logic flow.
NB: If you want to draw a specific Barrier
connection make sure you select the right mode
using the toolbar buttons before making the connection:
![]() Red - Relation is the Fail Connection
Red - Relation is the Fail Connection
![]() Green - Relation is the Success Connection
Green - Relation is the Success Connection
2.
Release the left mouse button when
over a target Symbol
.
These two Symbols are now connected. Repeat this procedure to add any number
of Relation lines.
3.
If the connection violates any of the
predefined rules, then the Relation is not permitted and a relevant message
is displayed on the lower status bar.
4.
If the source Symbol
is an Auxiliary Symbol
then the user is prompted to define which of
up to five outputs (ports) you are defining. Each output may only be used once.
The Relation then has a label denoting the connection number.
Editing
Symbols
To select a Symbol
click on it and a selection rectangle with handles
in the corners and on the sides will appear.
To edit the Symbol
details (Symbol Id, Text label etc.), double-click
on the Symbol and the relevant Symbol detail screen will be displayed allowing
the user to change the fields. Each type of Symbol has a different detail screen as described above.
To resize a Symbol
select it and drag one of the handles using
the left mouse button until the desired size is reached. Then release the mouse
button and the Symbol will be redrawn at the new size.
Editing
Relations
To select a Relation
click on it and handles will be drawn at various
points of the line. You can re-shape the line by clicking on one of the line
handles, dragging it across the worksheet
and release the mouse button.
Selecting a relation and pressing right mouse
click will allow the following two options:
|
Add
Link Text |
A dialogue screen will appear to allow the
user to key in free format text to describe the relation. This text will
appear against the relation on the worksheet
|
|
Remove
Link |
This will delete the relation from the worksheet
|
Moving
Symbols
To move a Symbol
select it and keeping the left mouse button
depressed, drag the mouse. A shadow image of the Symbol being moved will be
displayed. When the Symbol has been re-positioned, release the mouse button
and the Symbol is redrawn in the new position, moving all the connecting lines
with it.
Copying
Symbols
Symbols can be copied by selecting a Symbol
or a group of Symbols and or pressing right
mouse click and selecting Copy from
the menu. The following prompt screen will appear:
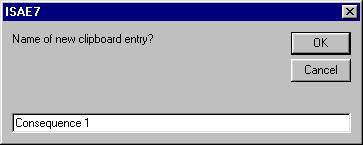
Enter a name for the Symbol
or group of Symbols that you are copying and
press OK. The items you have copied will be placed in the Clipboard Library
for future use.
To paste a group of copied Symbols
into the worksheet
you have to go to the Clipboard Library
. Press the CLIP icon
at the top of the screen. The Clipboard Library screen will be shown:

The clipboard library allows you to keep a
permanent library of copies of Symbols or groups of Symbols as required. The
following options are available:
|
Copy to Library |
|
|
Delete |
This will delete the entry from the library |
|
Paste |
This should only be available if you have
selected an entry in the clipboard library. The contents of the clipboard
entry will be pasted onto the worksheet
. |
|
Exit |
This closes the form and returns to the worksheet
|
When copying a Symbol
all the details entered for it will also be
copied. The Symbol Detail screen will
be displayed so that the user can change any details required (NB the Symbol
Id must be changed).
N.B.
Only
Symbols can be copied, not the relation lines attached to them.
Deleting
Symbols
To delete a Symbol
select it and press the Delete key or select
Edit/Delete from the Worksheet
menu. When deleting a Symbol all the Relation
lines connected to it will also be deleted.
Deleting
Relation Lines
To delete a Relation Line select it and press
the Delete key or select Edit/Delete from the Worksheet
menu.
If the File/Print
Worksheet
option is selected the Worksheet can be printed.
The following panel appears to assist the printing; the required printer must
be selected.
Although much of the validation process is
carried out as the Hazard is being drawn there are some checks that cannot be
completed until the whole Model is complete.
This function is carried out by selecting the
relevant Hazard, clicking on the RH mouse button and selecting Validate Hazard.
·
Ensuring that the Critical Event is specified.
·
Ensuring that all the In- and Out- Connectors
are correctly linked up.
·
Ensuring that all Symbols have the correct
number of inputs and outputs.
·
Ensuring that In-connectors coming
from a Logic tree can connect only with Base Events, Critical Events and Barriers,
and that only one such connection is made.
If no errors are found the message Hazard
validated no Errors found appears at the bottom of the screen.
The
available Model Association Symbols and the possible connections associated
with each one are described on the following pages.
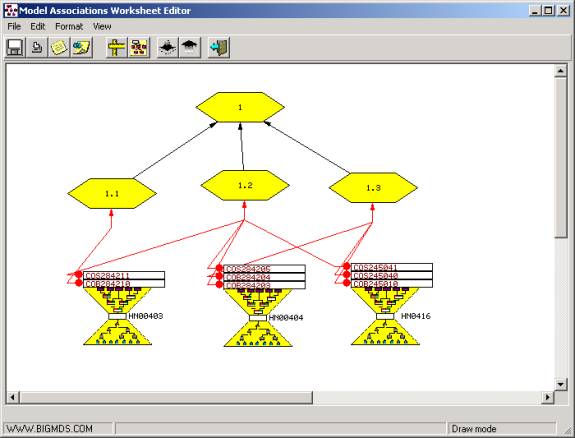
A
list of all available Models is displayed. This list can be scrolled until the
required Model is found. On selecting a Model the symbol is placed on the Worksheet
with the Model name beside it.
No
editing can be performed on the Model symbol itself, however the following types
of connections can be made from the Model:-
Virtual
Consequences are a conceptual summation point for several Consequences from
different Hazards.

The following fields may be entered:-
|
Name |
Mandatory.
From 5 to a maximum of 10 characters defining the Symbol
. It appears on the Symbol in the Worksheet
and must be unique. |
|
Description |
Mandatory.
A short description of the In-Connector. This also appears on the Symbol
in
the Worksheet
. |
|
Group |
Optional.
Can be se selected from the drop-down list. |
Super
Connectors allow several inputs to be summed into one output. All inputs to
the Super Connector must be of the same type i.e. either Frequencies, Probabilities
or Risks.
If
inputs are Frequencies or Probabilities the output is the sum of all niputs.
If
inputs are Risks, the output is the sum of the risks for each of the 13 Risk
categories.
The
user is asked whether the inputs to this Super Connector are Risks. If so a
Risk Super Connector is created, otherwise a Frequency Super Connector is drawn.
No
editing can be performed on the Super Connector symbol itself, however the following
types of connections can be made from the Super Connector:-
Splitters
allow several inputs to be split into 2 outputs according to the specified allocation
percentage for each output. All inputs
to the Splitter must be of the same type i.e. either Frequencies, Probabilities
or Risks.
The
following Screen is shown:

If
the user selects the Outputs to be Frequencies or Probabilities the split percentage
of the first Split must be entered as a value between 0 and 100. The second
Split value will then be automatically calculated. The Description fields can
also be entered.
Each
output is the percentage allocation of the inputs in this case Output 1 (Pedestrian
) will be allocated 90% of the input Frequencies/Probabilities and Output 2
(Road Vehicle) will be allocated 10%.
Similarly
if the user selects the Outputs to be Total Risk, the 2 percentage values are
calculated in the same way.
Each
output is the percentage allocation of the inputs applied to all the Risk categories
lumped together in this case Output 1 (Pedestrian ) will be allocated 90% of
the input Risks values for all Risk Categories and Output 2 (Road Vehicle) will
be allocated 10%.
However
if the user selects Individual Risk the screen appears as follows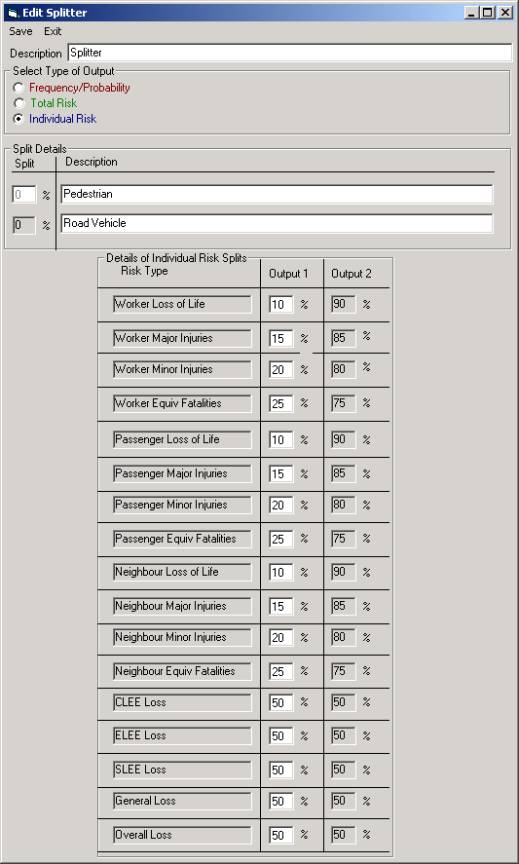
In
this case the user can specify a different percentage allocation for each of
the 13 Risk Categories.
For
example Output 1 (Pedestrian ) will be allocated 10% of the input Risks for
the Worker Loss of Life category and Output 2 (Road Vehicle) will be allocated
90% of the input Risks for the same category.
The
following types of connections can be made from the Splitter:-
The
following types of connections can be made from the AND/OR Gate:-
These
symbols are used to connect Worksheets. These Connectors have the same functions
as Virtual Consequences except that they can be linked across Worksheets. Only
Risk links may be connected in this way.
When
a Worksheet is full an Out-Connector must be created so that the diagram can
be continued on another Worksheet. The user will be asked to give a unique name
to this Out-Connector.
Out-Connectors
can only be linked to In-Connectors.
An
In-Connector must then be drawn on the succeeding Worksheet. A list of the available
Out-Connectors will be displayed and the user must select the one to be connected
to this In-Connector. If there are no Out-Connectors then an In-Connector cannot
be created.
The
following types of connections can be made from an In-Connector:-
Although
much of the validation process is carried out as the Model Associations are
being drawn there are some checks that cannot be completed until the whole World
Model is complete.
To
do this RH mouse click on Links and Associations in the Explorer screen
and select Validate Model Associations.
·
Ensuring that each Splitter has 2 outputs.
·
Ensuring that all the In- and Out-
Connectors are correctly linked up.
·
Ensuring that Symbols have the correct
number of inputs and outputs.
If
no errors are found the message Valdiation complete no Errors found
appears at the bottom of the Explorer screen.